


A tutorial on discounted cashflow (DCF) analysis - Part 1
From a statistician and data scientist perspective

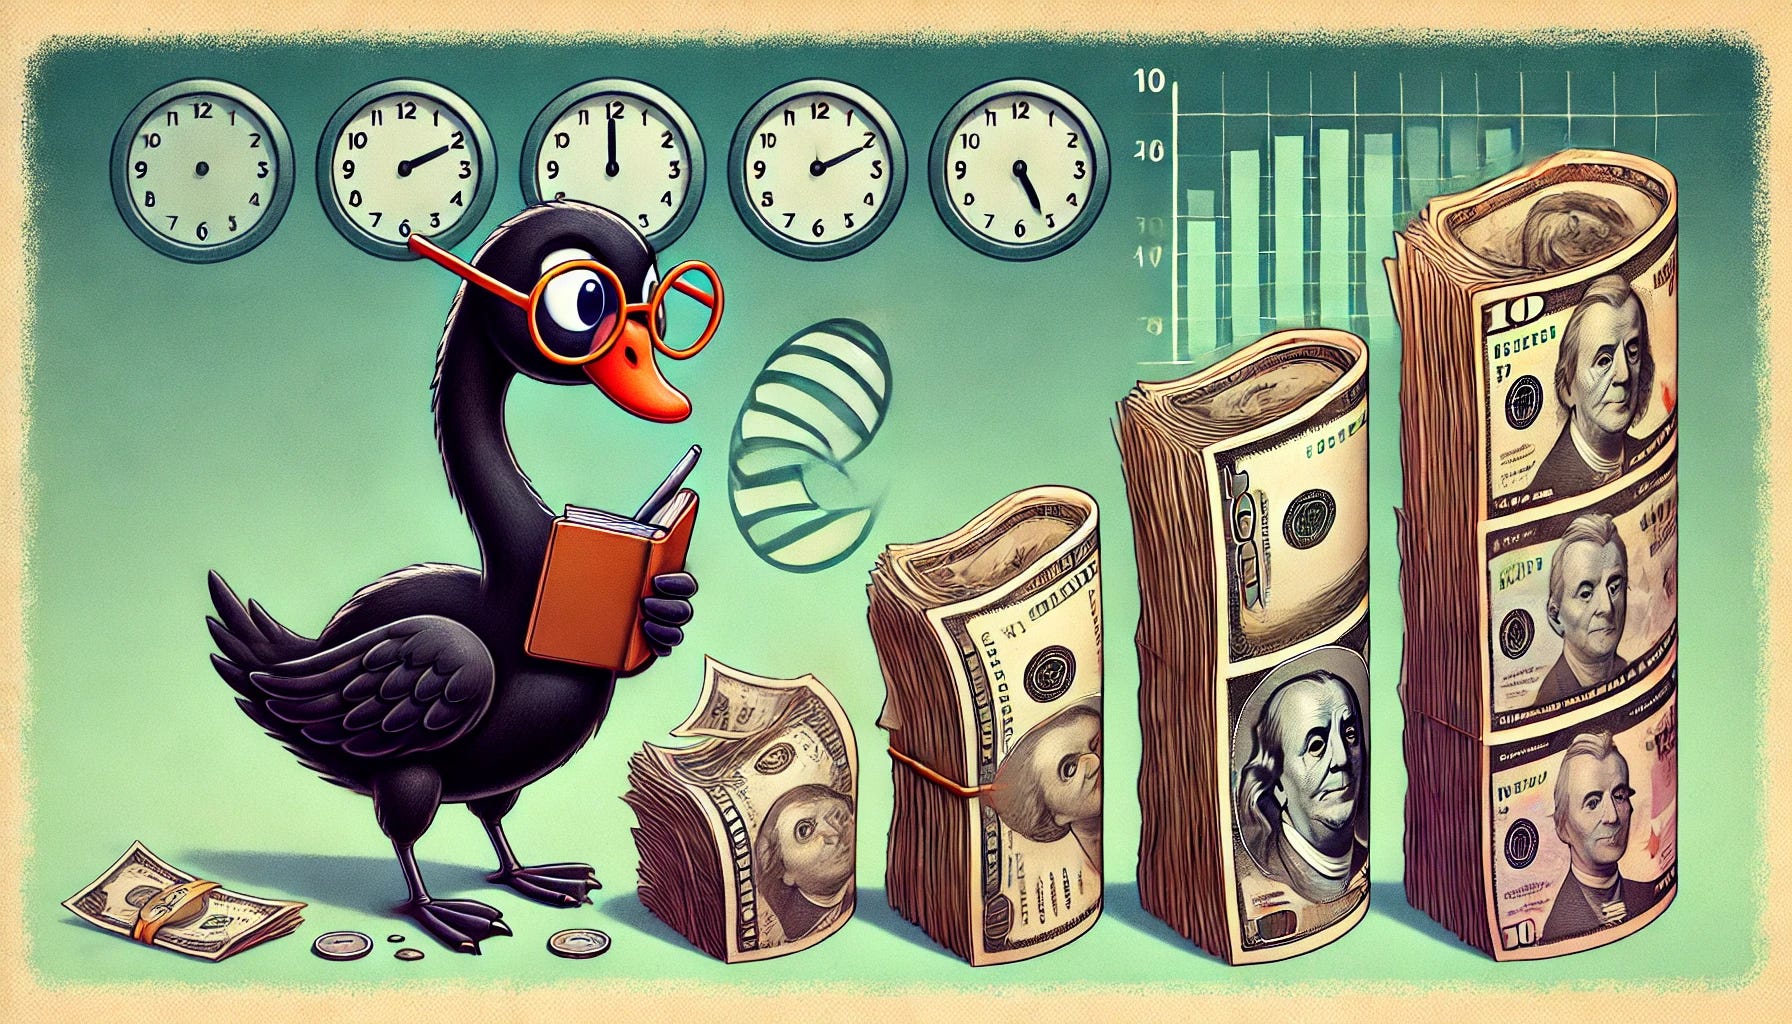
Discounted cashflow analysis is one of the most popular methods of stock valuation and is the primary way by which I assess stock valuation. Although DCF analysis can now be run on any number of financial websites with a click of a button, I believe the true value of DCF analysis can only be gained by understanding both the concept and details behind it. In Part 1 here, I try to explain the concept behind DCF analysis and remove much of the financial jargon. In Part 2 to follow, I’ll go through more of the math and details in DCF analysis from a statistician’s viewpoint. I’ll attempt to peel back the black box and provide a perspective on how I interpret the numbers.
The Concept of Discounted Cash Flow Analysis
To understand the concept of discounted cash, let’s start with a hypothetical scenario. Imagine you won the lottery for $1 million dollars. The lottery commission comes and gives you a choice: Option A) get $1 million dollars today or Option B) get $1 million dollars after waiting 10 years. In this case, everyone would choose option A. If I have the money today, I can spend it right away. Even if I don’t spend it right away, I can put it into a high yield CD and collect interest. This is fundamental concept #1 behind discounted cash, that cash today is worth more than cash in the future.

Now let’s take this idea one step further. Suppose the lottery commission comes and instead gives you a different choice: Option A) get $1 million dollars today or Option B) get $2 million dollars after waiting 10 years! This choice now becomes a bit less clear. Assuming there isn’t some outside forces that make this decision obvious (such as the mafia coming after you for a high interest loan, a terminal disease, or an irresistible shopping spree), the majority of us would now need to stop and consider which is actually the better choice. The nice thing here is that you can work out all the scenarios assuming you don’t spend the money and compare what happens in 10 years.
Scenario 1: We take the $1 million dollars today, hide it under our mattress and in 10 years we have … $1 million dollars.
Scenario 2: We take the $1 million dollars today, we put it in that high yield CD of 4% and in 10 years we have… 1 million * 1.04^10 = $1.48 million dollars.
Scenario 3: We take the $1 million dollars today, we buy a total US stock market index, it has some up years and down years and at the end of 10 years, assuming around historical average market returns of about 9%, we have 1 million * 1.09^10 = $2.37 million. Note in this case, you might also end up with considerably less if things didn’t go well. That’s the risk component.
Scenario 4: We take Option B from the lottery commission and at the end of 10 years, we have … $2 million dollars.
Once we put all these numbers together, we can quantitatively compare our options. Scenarios 1, 2, and 4 are all relatively low risk and in that case, Scenario 4 is clearly the best choice. Incidentally, the $2 million equates to an annualized return of approximately 7.2%. ($1 million * 1.072^10 = $2 million dollars). Depending on our risk tolerance, Scenario 3 could actually be better since we would end up with on average $370,000 more than from Scenario 4. This point highlights fundamental concept #2 behind DCF analysis, higher risk should be justified with higher gains.
Now the problem with talking about what will happen 10 years from now is that it’s hard to follow. When I buy an ice cream cone for $5, I don’t think in “10-year-in-future dollars”. So instead, we “discount” future money back to today’s value based on what we call a discount rate. The discount rate is essentially how much we believe our money should make each year for us given the risk we’re taking. If we believe we can make 7.2% a year (7.2% discount rate), the $2 million dollars offered by the lottery commission 10 years later is exactly the same as the $1 million dollars today. If instead, we believe a 9% discount rate is more appropriate, then the $2 million dollars 10 years from now is only worth $2,000,000/(1.09^10) = $845,000 today.
Bringing this back to valuing companies, the concept of DCF analysis is to determine how much money would you be willing to pay for the company today (Option A from the Lottery Commission) given what it can potentially make in the future (Option B from the Lottery Commission) once you’ve discounted for the future dollars. An option with a lower risk like the Lottery Commission guaranteeing a payout in 10 years, deserves a lower discount rate than an option that has higher risk and uncertainty.
In Part 2 of this tutorial, I’ll cover the math behind discounted cash flow analysis, when is it not appropriate, and applying a bit of statistics to extend DCF analysis to capture multiple future possibilities.
Update: Part 2 is now available here.
If you enjoyed this content, consider heading over to our Investing Academy to learn about other investing topics.
Disclaimer: Any information contained here is not intended as, and shall not be understood or construed as, financial advice. I am not a financial advisor and this is only a documentation of my personal investment journey and decisions. You should always do your own research before making any final decision on investments.